 included below.
A story in five — or is it six — parts from the imagination of Tina Holmboe
It was a dark and stormy night … really a bit more grey than dark, and it wasn’t a night, it was the day, and it wasn’t one, it was all bloody thirty of them.
November, in Scandinavia, was a washed–out, grey and dreary month. This played merry hell with the PV system. So, a bit early: The Album.
The whatsits⁇
Think of the following as a kind of “collected works” — or, less flippantly, a summary of the summary. Rather meta, eh, what?
It is not required to read the prior five parts of this, but it’s not likely you’ll understand a word of this unless you do. Your choice, naturally :)
At the very end of this instalment there’s a short PV FAQ.
Conclusion first: when extrapolated over time, our return on investment is excellent.
Since 2019 we’ve actively worked to cut energy usage and increase autarky1. The following table show the results (with some guesswork at the end ;) )
| Year | Purchased kWh | Changes made | |
|---|---|---|---|
| 2019 | 35,000 | Accumulator tank anno 1984 | |
| 2021 — 2022 | 16,800 | Installed a ground heat pump | |
| 2022 — 2023 | 9,300 | PV system installed with 11kWh battery | |
| 2023 — 2024 | 4,300 | Adding 22kWh to the battery stack |
During this time, the cost of energy in Sweden has changed rather dramatically.
In 2018 we paid 1.32 SEK per kWh, all inclusive2, or 3,567 British Pound Sterling. That’s bloody painful, but doable.
The last four years or so has seen a price hike: the cost per purchased kWh (“floating” contract) has increased by 282%. In 2022 we’d subsequently pay 5.04 SEK/kWh, or an entirely farcical 13,900 quid (!)
Full disclosure: we got a far better, fixed price, deal than the above. Not that much better, but still better. Yay for local suppliers.
How ’bout the investments, then? Per December 2022:
| Investment | Break–even (years) | RoI | |
|---|---|---|---|
| Heat pump | 4.6 | 21.9% | |
| PV + 11kWh battery | 8.7 | 11.5% | |
| 22.1 kWh battery | 9.6 | 10.5% | |
| 33.1 kWh battery | 10.1 | 9.9% |
Our original break–even estimate for the PV–setup including 11kWh battery was 12.5 years … accompanied by a RoI of 8%.
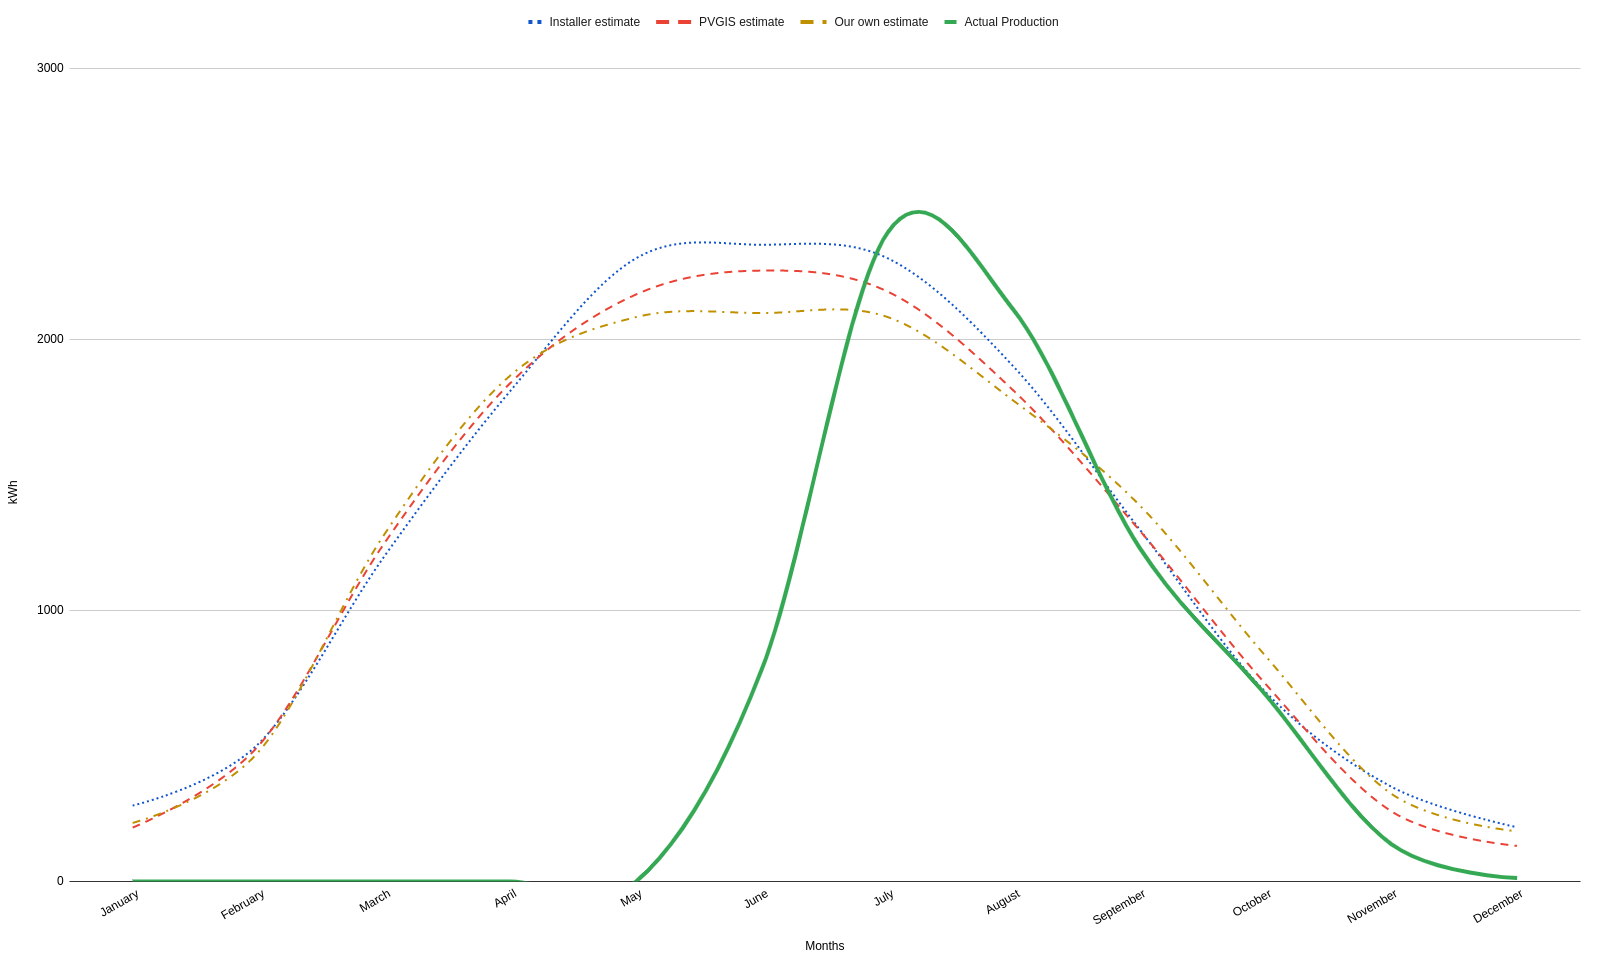
Let’s dig a little deeper. When we started the PV project we had three estimates on hand: the installer’s, one from the PVGIS tool, and finally our own calculations. Personally I trust the latter; J’s got a master in measurement physics :)
After six months or so we also have a — partial — result, included below.
From the material we can conclude —
Since we started production on the 23rd of June, numbers before that date are quite ignore–able.
A new set of numbers will be posted on the 24th of June 2023, or thereabouts.
| Month | Installer | PVGIS | Our own | Actual | |
|---|---|---|---|---|---|
| January | 280.00 | 198.74 | 216.00 | 0.00 | |
| February | 580.00 | 500.61 | 478.00 | 0.00 | |
| March | 1,200.00 | 1,248.30 | 1,281.00 | 0.00 | |
| April | 1,810.00 | 1,839.02 | 1,867.00 | 0.00 | |
| May | 2,300.00 | 2,166.48 | 2,083.00 | 0.00 | |
| June | 2,350.00 | 2,254.72 | 2,098.00 | 784.00 | |
| July | 2,300.00 | 2,176.83 | 2,083.00 | 2,396.00 | |
| August | 1,900.00 | 1,811.26 | 1,774.00 | 2,109.00 | |
| September | 1,300.00 | 1,295.99 | 1,389.00 | 1,232.00 | |
| October | 700.00 | 729.83 | 833.00 | 690.00 | |
| November | 350.00 | 259.33 | 324.00 | 138.00 | |
| December | 200.00 | 131.28 | 185.00 | 12.30 |
In the graph, the blue dotted line represent the installer’s estimate, the red dashed line is the data from PVGIS, the yellow dot–dashed line is our own calculations.
The green line is the actual production.
On the other hand there’s the buy and sell bit. 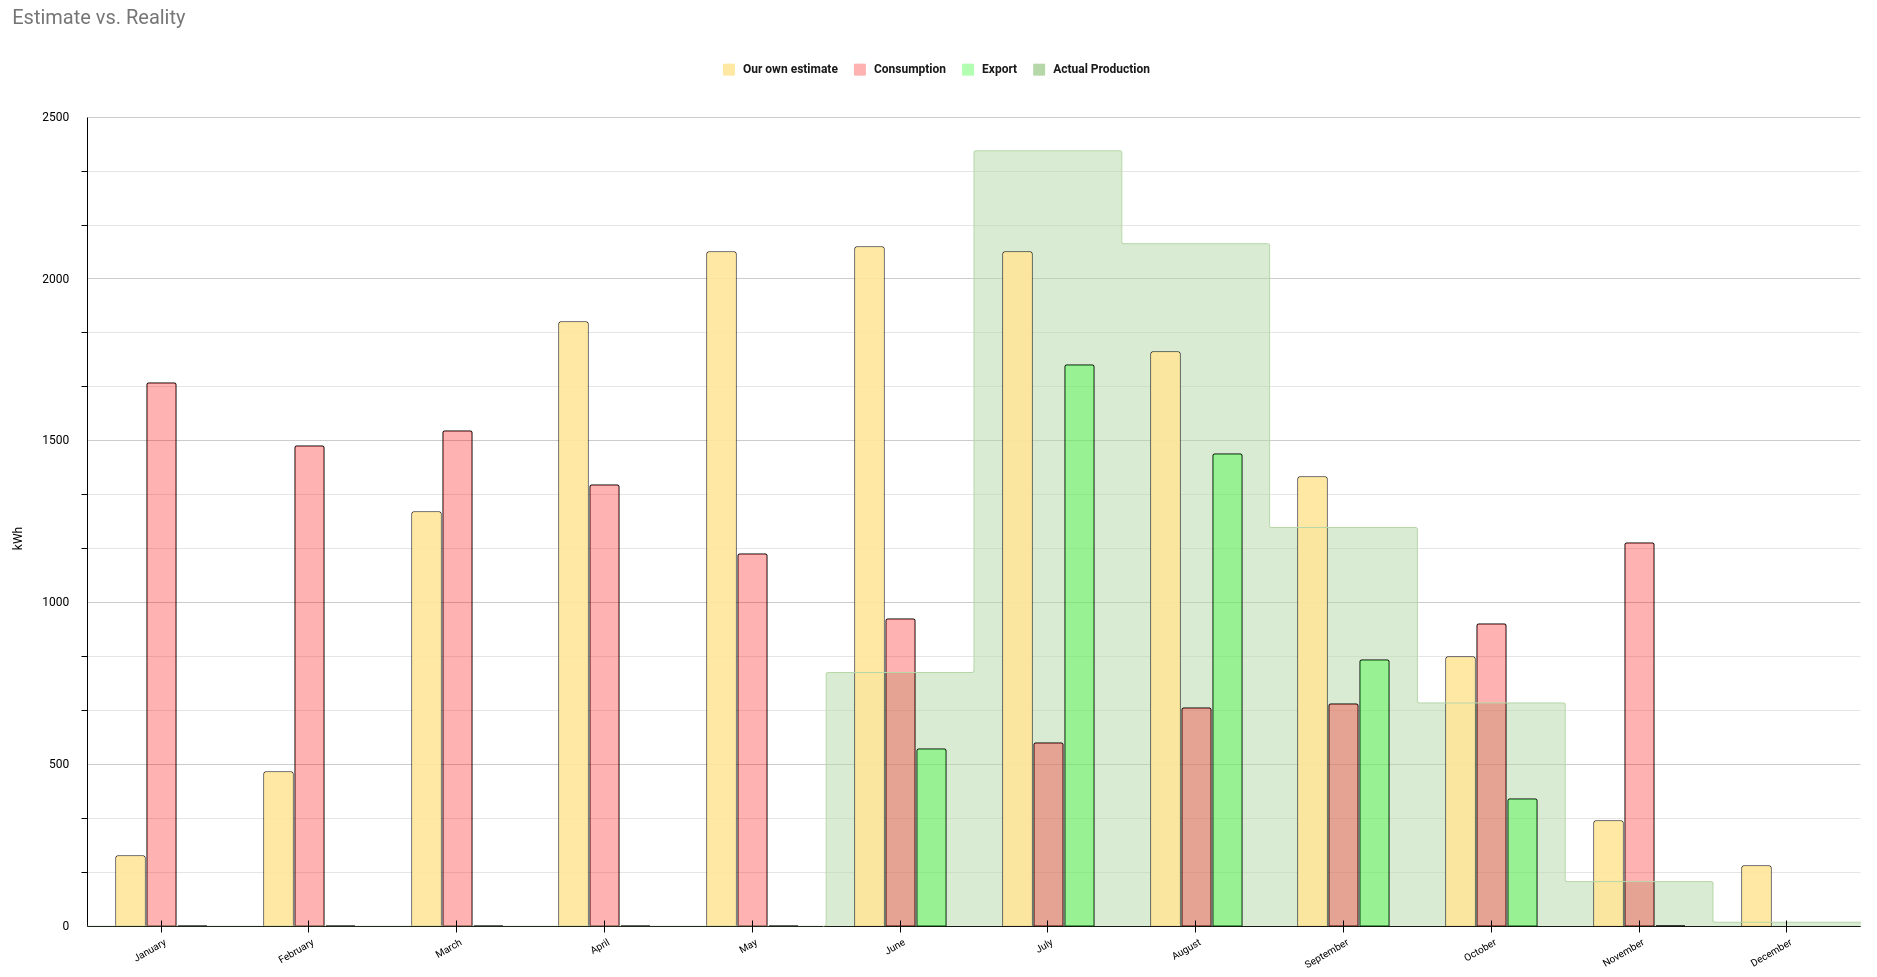
In the graph the yellow column is our own estimate of production, the red column is the actual consumption, i.e. what we had to purchase from the grid; the green column is the surplus energy we exported to the grid and the light green shaded area is the actual energy produced by the PV system.
The x–axis represent months; the y–axis kWh.
During the months of July, August and September we produced enough to cover all our energy needs and export. We still had to buy, as the battery stack was not active until November (a missing part). The estimated production was close to the actual.
During October the number of sun hours dropped, the actual production went down below the estimate, but for daylight hours there was still enough surplus to export.
November was, again, cr*p. Actual production was a shadow even of the estimate, and we had to buy rather alot. Happily that’s only one month of the year.
| Month | Produced | Purchased | Export | |
|---|---|---|---|---|
| January | 0.00 | 1,677.00 | 0.00 | |
| February | 0.00 | 1,483.00 | 0.00 | |
| March | 0.00 | 1,530.00 | 0.00 | |
| April | 0.00 | 1,364.00 | 0.00 | |
| May | 0.00 | 1,149.00 | 0.00 | |
| June | 784.00 | 949.91 | 546.33 | |
| July | 2,396.00 | 567.52 | 1,734.59 | |
| August | 2,109.00 | 675.57 | 1,459.27 | |
| September | 1,232.00 | 686.97 | 821.19 | |
| October | 690.00 | 935.19 | 394.06 | |
| November | 138.00 | 1,185.00 | 0.00 | |
| December | 12.30 |
Our conclusion, if a little premature, is that the PV system is producing more–or–less exactly as we expected. Yay.
After some eight months3 of home automation, we can reasonably conclude that:
They all works well — even in combination. We experience no conflicts, nor is the stone building blocks of the downstairs computer room an impediment. The farthest sensor is approx. 8 meters from the antenna, but only three meters from its nearest sibling node — here we reap the benefit from mesh topology networks (and, yes, a huge wifi repeater in the garage)
Eminently useful product for collecting, collating and presenting information from various sensors.
High maintenance, sadly, due in part to a highly active (per Q4 2022) development schedule, in part to the choice of Jinja (and yaml!) as the template language, and in part because the documentation is in need of some TLC. Badly need of.
The product also has some oddities in itself: the default retention period of the Home Assistant database is ten days. Observing monthly use of energy becomes hard …
Note that we have settled on the following list, but we do not in any way endorse the companies or products, nor do we receive any form of kickback, bribes, cash or champagne.
The list is, however, those products we know will work with Home Assistant.
| Brand | Purpose | Network | |
|---|---|---|---|
| Philips Hue | Light–bulbs and motion | Zigbee | |
| Aqara | Temperature, moisture and vibration | Zigbee | |
| Fibaro | Smoke detection | Z–Wave | |
| Shelly | 1– and 3–phase power measurement | Wifi | |
| Dresden | Conbee II USB Zigbee Controller | Zigbee (duh) | |
| Aeotec | Z–Stick Gen5+ USB Z–Wave Controller | Z–Wave |
Worth noting may be that we use no “hubs” save the Philips one, nor is anything of the above cloud–connected4.
Several, going from “simple” through “complicated” to “insane”.
Not easily adapted to home use, pumped solar is an excellent solution for long–term, large–scale energy storage. The principle is easy: use surplus energy to pump water from one reservoir to another. Ensure the second one is significantly higher than the first. When energy is needed, drop the water from the second back down to the first through a set of turbines. Might best be called gravity storage. No particular upper limit exist as far as I know. Two examples are the Snowy 2.0 project in Australia (350GWh) and Nant de Drance in Switzerland (20GWh).
This trick can also be done by, for example, pulling a train up a gradient and dropping it back down, or putting up a huge crane and lift concrete blocks with surplus energy. It might just be easier to re–use existing hydro–electric …
This is not readily adaptable for home use :) even tho some would include hot water storage tanks in this section.
The basic idea is simple enough: use surplus energy from, for example, solar to heat a medium. When energy is required, extract it from the medium.
Quite a few buildings in Sweden have this, using an “accumulator tank” (hot water storage) connected to a hydronic heating system
It’s difficult to extract electricity from.
Next step up is molten salt which is exactly as it sounds: use solar to melt salt. Add energy to keep it melted at around 200C. Extract by boiling water to steam.
And, of course, there’s molten aluminium; same principle but at 800C, or hot silicon at 1400. Don’t try to adapt these for home usage …
It’s also possible to scale up the hot water idea; the Mustikkamaa cavern in Finland holds 260,000m3 and ~11GWh.
Again with the phase transition: use solar to compress oxygen or nitrogen until it turns into a liquid. Keep the liquid until needed (this is fairly easy, oddly enough) then run it through a heat exchanger and turn it back into gaseous form … which means a massive increase in pressure which in turn can drive a turbine.
I shan’t spend too much time on it, just mention the most esoteric method of long–term energy storage I personally have run across so far: solid state hydrogen …
We all know of liquid or gaseous hydrogen storage. These methods are not too good, since — for example — storing hydrogen is difficult. It’s a tiny thing, a H2 molecule, and they tend to escape.
It’s a bit squirrelly: turn hydrogen into solid bricks, store these indefinitely (yeah, right), then cook’em to 300C and return to a gaseous state that can burn. Not on the market yet, oh, no. And, as with all things hydrogen, tends to losses.
Old idea, tho; 1899 or thereabouts :)
A new idea, on the other hand, is using ammonia (NH3) as a carrier for hydrogen. It’s a non–organic compound, it’s (comparatively) easy to store, and easy to produce. Once energy is needed, it’s extracted (cracking) in the form of hydrogen used to power a fuel–cell.
I did mention “insane”, didn’t I? Introducing the FES, or flywheel energy storage, concept.
The idea isn’t as odd as it sounds: take a rotor (the flywheel) and spin it — using surplus PV for example — up to a high speed. When electricity is required, connect the (still spinning!) flywheel to a generator. Easy!
So where’s the insanity? That comes from installing a 3000kg, 1m concrete flywheel under your lawn and spin it at around 40,000 RPM to store 10kWh and hope, hope it won’t jump a bearing …
Damned cool insanity, mind!
A number, depending on your needs.
Rain. Fog. Snow. Remember that the actual irradiance is the same, regardless of weather. Even without direct sunlight on a PV panel it’ll generate electricity. With rain — as an example — in play, you get diffraction. Consider one of those lovely days with sunshine and a brief rainfall. The drops will interfere with the light and prevent the panels from catching enough photons.
This is the same effect you’ll get if you shine a flashlight at night, with a fine rain. The strength of light will appear less.
A DC–connected LiFePO4 (LFP) modular stack of between 11 and 33 kWh works well for a normal size villa (200m2).
1 Fancy word for “self–sufficiency”, in this context how independent (or not!) we are of an externally owned power grid.
2 “Spot” price (off the Nordpool power exchange), VAT, taxes, e.t.c., e.t.c., ad nauseam.
3 We deployed the Home Assistant container in Docker on Ubuntu the 5th of February 2022. Since then we have added sensors according to need.
4 One major exception: the notification service Home Assistant use in order to get alerts on our cell phones uses Firebase, a Google cloud thingamabob. The information sent through this service is, however, entirely worthless to anyone other that us.
index
2009 — 2013 archive (aka "ye olde stuff")
© Tina Holmboe, Jörgen Andreasen
2010 — 2023
Creative Commons BY-ND 4.0
